How Much Protein Do You Actually Need?
Protein needs are not one-size-fits-all. The U.S. Recommended Dietary Allowance (RDA) of 0.8 g per kilogram of body weight is the minimum amount needed to prevent deficiency in a sedentary adult — it is not necessarily the optimal amount for someone who exercises, is trying to build muscle, or is losing weight. The International Society of Sports Nutrition (ISSN) and the American College of Sports Medicine both recommend higher intakes, generally in the range of 1.2–2.0 g/kg, for physically active people.
This calculator gives you a quick, personalized starting estimate based on your body weight, activity level, and goal. It is meant as a practical guideline, not a medical prescription — anyone with kidney disease, liver disease, or another condition affecting protein metabolism should get individualized advice from a doctor or registered dietitian.
For a broader view of your nutrition, you can also check our full range of body and fitness calculators.
How the Calculation Works
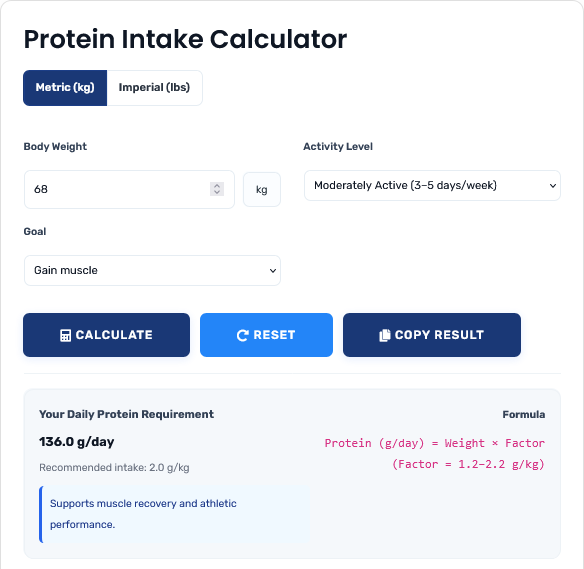
Base formula used by this calculator:
Protein (g/day) = Body Weight (kg) × Factor
The factor is set by your activity level (1.2–2.0 g/kg) and then adjusted slightly for your goal — a small increase for fat loss (to help preserve lean mass in a calorie deficit) and a larger increase for muscle gain.
This mirrors the general approach used by most evidence-based protein guidelines: start from body weight, adjust for activity, and adjust again for goal. It is a practical starting point rather than a lab-grade prescription — your real-world needs can shift with age, muscle mass, training experience, and overall diet quality.
Recommended Protein Ranges by Group
| Population Group | Typical Range | Why |
|---|---|---|
| Generally healthy, sedentary adults | 0.8–1.0 g/kg | Covers basic maintenance and prevents deficiency (RDA) |
| Recreationally active adults | 1.2–1.6 g/kg | Supports recovery from regular exercise |
| Strength/resistance-training athletes | 1.6–2.2 g/kg | Supports muscle repair and hypertrophy |
| Endurance athletes | 1.2–1.8 g/kg | Preserves lean mass during high training volume |
| Dieting for fat loss (calorie deficit) | 1.6–2.4 g/kg | Higher intake helps protect lean mass while losing fat |
| Older adults (65+) | 1.0–1.5 g/kg | Helps counter age-related muscle loss (sarcopenia) |
| Pregnant/lactating individuals | 1.1–1.7 g/kg (or per clinician guidance) | Supports growth and increased physiological demand |
Ranges are general guidelines drawn from published sports nutrition and dietetics literature (see references below), not individualized medical advice.
Common Protein Myths, Explained
"More protein always means more muscle"
Muscle protein synthesis after a meal has a practical ceiling — research generally shows diminishing returns on muscle growth once total daily intake goes much above roughly 1.6–2.2 g/kg for most trainees. Extra protein beyond what your body can use for repair and growth is used for energy or stored, not converted into extra muscle.
"Plant protein is always inferior to animal protein"
Plant proteins can have a lower digestibility and may be missing one or more essential amino acids individually, but combining sources (like rice and beans, or lentils and grains) across the day easily provides a complete amino acid profile. Slightly higher total intake (roughly 10–20% more) can offset the lower digestibility of some plant sources. A mixed diet of plant and animal protein can meet protein needs for almost anyone.
Does Protein Timing Matter?
Total daily protein intake matters more than precise timing, but spreading protein across 3–5 meals (rather than concentrating most of it at dinner) appears to support muscle protein synthesis somewhat better than a heavily skewed pattern. Consuming protein within a few hours of resistance training, and again before sleep, are commonly recommended practices among athletes and coaches, though the effect size is modest compared to simply hitting your total daily target consistently.
Practical Tips for Meeting Your Protein Target
- Recalculate periodically — your protein needs change as your weight, activity level, or goal changes.
- Spread intake across meals — aim for roughly 20–40g of protein per meal rather than one large serving at dinner.
- Mix protein sources — combine animal and plant sources for amino acid variety, fiber, and micronutrients.
- Prioritize protein around training if you exercise regularly, without ignoring your total daily target.
- Track loosely, not obsessively — hitting your range consistently over weeks matters more than being exact every single day.
For a fuller picture of your daily nutrition, you may also want to check our macro nutrient calculator and our calorie intake calculator.
Signs You May Be Under- or Over-Consuming Protein
Possible signs of inadequate protein include slow recovery after exercise, unexplained muscle loss, persistent fatigue, or slow wound healing. Very high protein intakes sustained over time, especially without adequate hydration, have been associated in some individuals with digestive discomfort; people with existing kidney conditions should discuss high-protein diets with their doctor first. If you notice any of these signs, it's worth speaking with a registered dietitian rather than guessing.
References
- Jäger R, et al. International Society of Sports Nutrition Position Stand: protein and exercise. J Int Soc Sports Nutr. 2017.
- Bauer J, et al. Evidence-based recommendations for optimal dietary protein intake in older people (PROT-AGE Study Group). J Am Med Dir Assoc. 2013.
- National Institutes of Health — Dietary Reference Intakes for protein.
- Morton RW, et al. A systematic review, meta-analysis and meta-regression of the effect of protein supplementation on resistance training-induced gains in muscle mass and strength. Br J Sports Med. 2018.
Frequently Asked Questions
The RDA of 0.8 g/kg is the minimum amount needed to prevent deficiency in a healthy, sedentary adult — it is not necessarily the optimal amount if you exercise or want to build or preserve muscle. Most active adults benefit from 1.2 g/kg or more.
Most research on resistance training suggests 1.6–2.2 g/kg of body weight per day is enough to maximize muscle growth for most people, combined with a structured training program. Intakes above this range generally don't provide additional muscle-building benefit.
Yes — during a calorie deficit, higher protein intake (roughly 1.6–2.4 g/kg) helps preserve lean muscle mass while you lose fat, and can also help you feel fuller on fewer calories.
Yes. Combining different plant protein sources across the day (grains, legumes, soy, nuts) can provide all essential amino acids. Total intake may need to be slightly higher to account for generally lower digestibility of some plant proteins.
No — total daily intake is the most important factor. Timing (spreading protein across meals, eating some after training) can offer a modest additional benefit, but it won't make up for an insufficient daily total.
For people with healthy kidneys, current evidence doesn't show that higher protein intake causes kidney damage. However, people with existing kidney disease are usually advised to limit protein intake, so they should follow their doctor's specific guidance rather than general calculators.