What Is Standard Deviation?
Standard deviation measures how spread out numerical values are around their mean. A smaller standard deviation means the observations are more tightly clustered; a larger standard deviation means they are more dispersed.
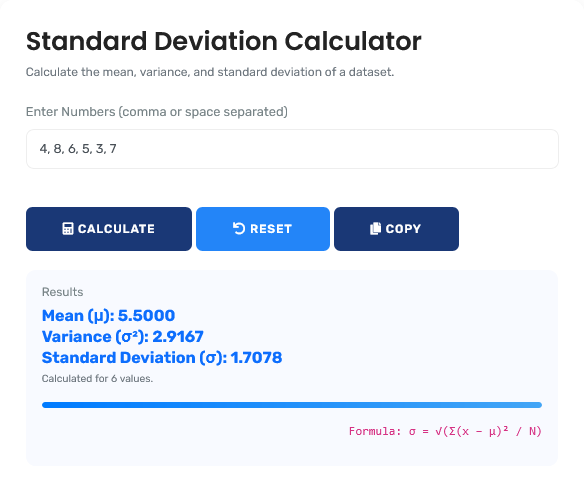
The calculator above supports both population standard deviation and sample standard deviation. It also shows the mean, variance, sum of squared deviations, range and a per-value calculation table so you can check how the result was produced.
Standard deviation is useful in statistics, education, quality monitoring, research and many other situations where you need to summarize variability. For measures of the center of a dataset, use the Mean, Median & Mode Calculator.
Sample vs Population Standard Deviation
The most important choice is whether your dataset represents the entire group you want to describe or only a sample from a larger population.
| Use | When to choose it | Variance denominator | SD symbol |
|---|---|---|---|
| Population | You have every observation in the population of interest. | N | σ |
| Sample | Your values are a sample used to estimate a larger population. | n − 1 | s |
Simple decision: Ask, “Did I collect every value in the group I care about?” If yes, use Population. If the data are only a subset of a larger group, use Sample.
Standard Deviation Formulas
Population standard deviation:
σ = √[Σ(xᵢ − μ)² / N]
Sample standard deviation:
s = √[Σ(xᵢ − x̄)² / (n − 1)]
Variance: The variance is the quantity inside the square root. Population variance is σ², while sample variance is s².
How to Calculate Standard Deviation
- Find the mean of the dataset.
- Subtract the mean from each value.
- Square each deviation.
- Add the squared deviations.
- Divide by N for a population or by n − 1 for a sample.
- Take the square root of the variance.
The calculator performs these steps automatically and displays the squared deviations so the result can be verified rather than treated as a black box.
Worked Standard Deviation Examples
Example 1: Population Standard Deviation
Data: 2, 4, 4, 4, 5, 5, 7, 9
Mean: (2 + 4 + 4 + 4 + 5 + 5 + 7 + 9) ÷ 8 = 5
Squared deviations: 9, 1, 1, 1, 0, 0, 4, 16
Sum of squared deviations: 32
Population variance: 32 ÷ 8 = 4
Population standard deviation: √4 = 2
Example 2: Sample Standard Deviation
Using the same eight observations as a sample:
Sample variance: 32 ÷ (8 − 1) = 32 ÷ 7 ≈ 4.5714
Sample standard deviation: √4.5714 ≈ 2.1381
How to Interpret Standard Deviation
Standard deviation does not have a universal “good” or “bad” threshold. Interpretation depends on the units, the dataset and what you are comparing.
| Pattern | Interpretation |
|---|---|
| SD = 0 | Every observation has the same value. |
| Smaller SD | Values are more tightly clustered around their mean than in a comparable dataset. |
| Larger SD | Values show more spread around the mean than in a comparable dataset using the same units and context. |
Important: Standard deviation can be calculated for non-normal data. However, strong skew or outliers can make the mean and standard deviation less representative of a “typical” observation. In those cases, consider the median and interquartile range alongside standard deviation.
The 68–95–99.7 Rule for Approximately Normal Data
When a distribution is approximately normal (bell-shaped), the empirical rule gives a useful interpretation of standard deviation:
- About 68% of observations lie within 1 standard deviation of the mean.
- About 95% lie within 2 standard deviations.
- About 99.7% lie within 3 standard deviations.
Do not automatically apply these percentages to strongly skewed or otherwise non-normal data. Use the Normal Distribution Calculator when working specifically with normal-distribution probabilities.
Common Standard Deviation Mistakes
Using the wrong formula. Population variance divides by N; sample variance uses n − 1.
Applying the empirical rule to every dataset. The 68–95–99.7 rule is intended for approximately normal distributions.
Ignoring invalid values. A calculator should never silently discard text or non-finite values from the dataset.
Assuming a larger SD is always “bad.” Standard deviation describes spread; whether that spread is desirable depends on context.
Ignoring outliers or skew. Standard deviation remains calculable, but median and IQR may provide important complementary information.
How to Verify Your Standard Deviation
You can cross-check the calculator in Excel or Google Sheets:
STDEV.P(range)for population standard deviation.STDEV.S(range)for sample standard deviation.
You can also verify that standard deviation² = variance, allowing for rounding. For a direct variance calculation, use the Variance Calculator.
How we calculate: The calculator validates every numeric value, computes a stable running mean and sum of squared deviations, then divides by N for population variance or n − 1 for sample variance. Standard deviation is the non-negative square root of the selected variance.
Frequently Asked Questions
Population standard deviation describes all observations in the population of interest and uses N in the variance denominator. Sample standard deviation is used when the data are a sample from a larger population and uses n − 1.
When the sample mean is estimated from the same data, dividing by n would underestimate population variance on average. Using n − 1 is Bessel's correction and makes the usual sample variance an unbiased estimator of population variance under standard sampling assumptions.
Yes. Standard deviation is zero when every value in the dataset is identical. A one-value population therefore has a population standard deviation of zero.
No. Variance is calculated from squared deviations, and standard deviation is the non-negative square root of variance.
Yes. Mean and standard deviation describe different properties, so there is no general rule requiring standard deviation to be smaller than the mean.
No. Standard deviation can be calculated for non-normal numerical data. What does depend on approximate normality is the 68–95–99.7 empirical rule.
Yes. A population containing one value has no spread, so its population variance and population standard deviation are both zero.
No. The usual sample variance formula divides by n − 1. When n = 1, that denominator is zero, so sample standard deviation is undefined.
Next step: Use the Z-Score Calculator to measure how many standard deviations a specific value lies above or below the mean, or browse all Statistics Calculators.
