What Is a Z-Score?
A Z-score, also called a standard score, shows how many standard deviations a value lies above or below the mean. A positive Z-score means the value is above the mean, a negative Z-score means it is below the mean, and Z = 0 means the value equals the mean.
Z-scores are useful because they put values from different scales into the same standard-deviation units. For example, a score of 85 may look high or low depending on the mean and spread of the dataset. Once converted to a Z-score, its relative position becomes much clearer.
Z-Score Formula
Standard Z-score:
Z = (X − μ) ÷ σ
- X = raw score or observed value
- μ = mean
- σ = standard deviation
The same relationship can be rearranged to solve for another missing value: X = μ + Zσ, μ = X − Zσ, and σ = (X − μ) ÷ Z when Z is nonzero.
How to Calculate a Z-Score
- Subtract the mean from the raw score.
- Divide that difference by the standard deviation.
- Keep the sign of the result.
- Interpret a positive result as above the mean and a negative result as below the mean.
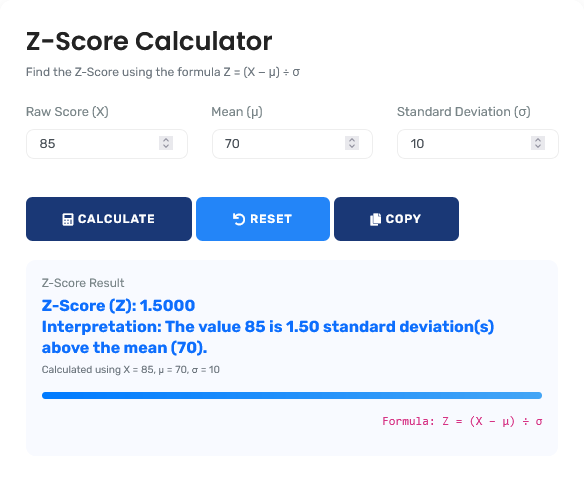
For example, with X = 85, μ = 70, and σ = 10:
Z = (85 − 70) ÷ 10
Z = 15 ÷ 10
Z = 1.5
Worked Examples
Example 1: Value Above the Mean
Raw score: 85
Mean: 70
Standard deviation: 10
Z = (85 − 70) ÷ 10 = 1.5
Interpretation: 85 is 1.5 standard deviations above the mean. Under a standard normal model, Z = 1.5 is approximately the 93.32nd percentile.
Example 2: Value Below the Mean
Raw score: 60
Mean: 75
Standard deviation: 10
Z = (60 − 75) ÷ 10 = −1.5
Interpretation: 60 is 1.5 standard deviations below the mean.
How to Interpret Z-Scores
| Z-score | Position relative to mean | Meaning |
|---|---|---|
| 0 | At the mean | The value equals the mean. |
| +1 | 1 SD above | The value is one standard deviation above the mean. |
| −1 | 1 SD below | The value is one standard deviation below the mean. |
| +2 | 2 SD above | The value is relatively far above the mean. |
| −2 | 2 SD below | The value is relatively far below the mean. |
A large absolute Z-score means a value is farther from the mean, but it does not automatically mean the value is an outlier or statistically significant. That depends on the distribution, context, and analysis method.
Z-Score to Percentile and Probability
A Z-score can always describe standardized distance from the mean, even when the original data are not normally distributed. However, converting a Z-score into a percentile or tail probability using the standard normal distribution requires a normal-model assumption.
For a standard normal model:
- The left-tail cumulative probability Φ(z) gives the proportion below the Z-score.
- The percentile is Φ(z) × 100.
- The right-tail probability is 1 − Φ(z).
- A two-tailed extreme probability is 2 × min(Φ(z), 1 − Φ(z)).
For broader distribution and probability calculations, use the Normal Distribution Calculator.
Z-Score vs Percentile
A Z-score expresses distance from the mean in standard-deviation units. A percentile expresses the proportion of observations below a value. They are related only after a distribution model is chosen. Under the standard normal model, Z = 0 corresponds to the 50th percentile, while Z ≈ 1.645 corresponds to the 95th percentile.
Common Z-Score Mistakes
Treating Z = 2 as automatically an outlier. It simply means the value is two standard deviations from the mean. Outlier rules are context-dependent.
Confusing a raw-score Z-score with a hypothesis-test Z statistic. The same letter is used in different statistical contexts, but the interpretations are not interchangeable.
Assuming percentile conversion works for every distribution. Standard-normal percentiles require a normal model to be appropriate.
Using a zero standard deviation. If σ = 0, every value in the dataset is identical and the usual Z-score formula is undefined.
How to Verify Your Answer
You can reverse the formula:
X = μ + Zσ
For Z = 1.5, μ = 70, σ = 10: X = 70 + (1.5 × 10) = 85.
If you still need the dataset's spread, calculate it first with the Standard Deviation Calculator.
How This Calculator Works
The calculator applies the standard-score relationship Z = (X − μ) ÷ σ and its algebraic rearrangements. Standard deviation must be greater than zero. When percentile or probability outputs are shown, they are calculated from the standard normal cumulative distribution and are labeled as normal-model interpretations.
Frequently Asked Questions
Yes. A negative Z-score means the value lies below the mean. For example, Z = −1.5 means the value is 1.5 standard deviations below the mean.
Z = 0 means the raw value is exactly equal to the mean.
No. The arithmetic standardization Z = (X − μ) ÷ σ does not require normality. Normality matters when you use the standard normal distribution to convert a Z-score into percentile or probability.
Under the standard normal model, Z = 1.96 has a left-tail cumulative probability of about 0.975, so it is approximately the 97.5th percentile.
No. It means the value is two standard deviations from the mean. Whether that should be treated as an outlier depends on the dataset, distribution, and the outlier rule being used.
A Z-score measures distance from the mean in standard-deviation units. A percentile measures the percentage of observations below a value. Under a normal model, the two can be converted using the standard normal cumulative distribution.
Use X = μ + Zσ. Enter the Z-score, mean, and standard deviation in the calculator and choose “Raw Score (X)” from the Calculate menu.
Next step: Use the Standard Deviation Calculator when you need to calculate the spread first, or explore all Statistics Calculators.
